BMI Calculator & Guide
Calculate your Body Mass Index, explore the reference table, and understand what BMI actually tells you — and where it falls short.
Body Mass Index (BMI)
BMI is one of the most studied, most validated, and most useful screening tools in public health. It's a ratio of your weight to your height, and it provides a reliable estimate of body fat for the vast majority of people.
The Formula
BMI = weight (kg) ÷ height (m)² — or equivalently — BMI = weight (lb) × 703 ÷ height (in)²
| BMI Range | WHO Classification | Health Risk |
|---|---|---|
| < 18.5 | Underweight | Increased |
| 18.5 – 24.9 | Normal weight | Average |
| 25.0 – 29.9 | Overweight | Increased |
| 30.0 – 34.9 | Obese (Class I) | High |
| 35.0 – 39.9 | Obese (Class II) | Very High |
| ≥ 40.0 | Obese (Class III) | Extremely High |
Why BMI Still Matters
The internet loves to dismiss BMI. "It doesn't account for muscle mass!" True — for elite athletes. For the average person, BMI is remarkably well-correlated with body fat percentage and disease risk:
- Flegal et al. (1998) — BMI correlates at ~0.7-0.8 with body fat percentage in general populations.
- WHO meta-analyses consistently show BMI above 25 predicts increased risk of type 2 diabetes, cardiovascular disease, and all-cause mortality.
- The "BMI doesn't work for muscular people" argument applies to roughly 2-3% of the population — competitive bodybuilders and professional athletes.
BMI Limitations (What You Should Know)
- Doesn't distinguish between fat and muscle mass
- Doesn't account for fat distribution (visceral vs. subcutaneous)
- Less accurate for elderly, pregnant women, and growing children
- Ethnic variations in body composition exist
- Should be used alongside waist circumference and other metrics
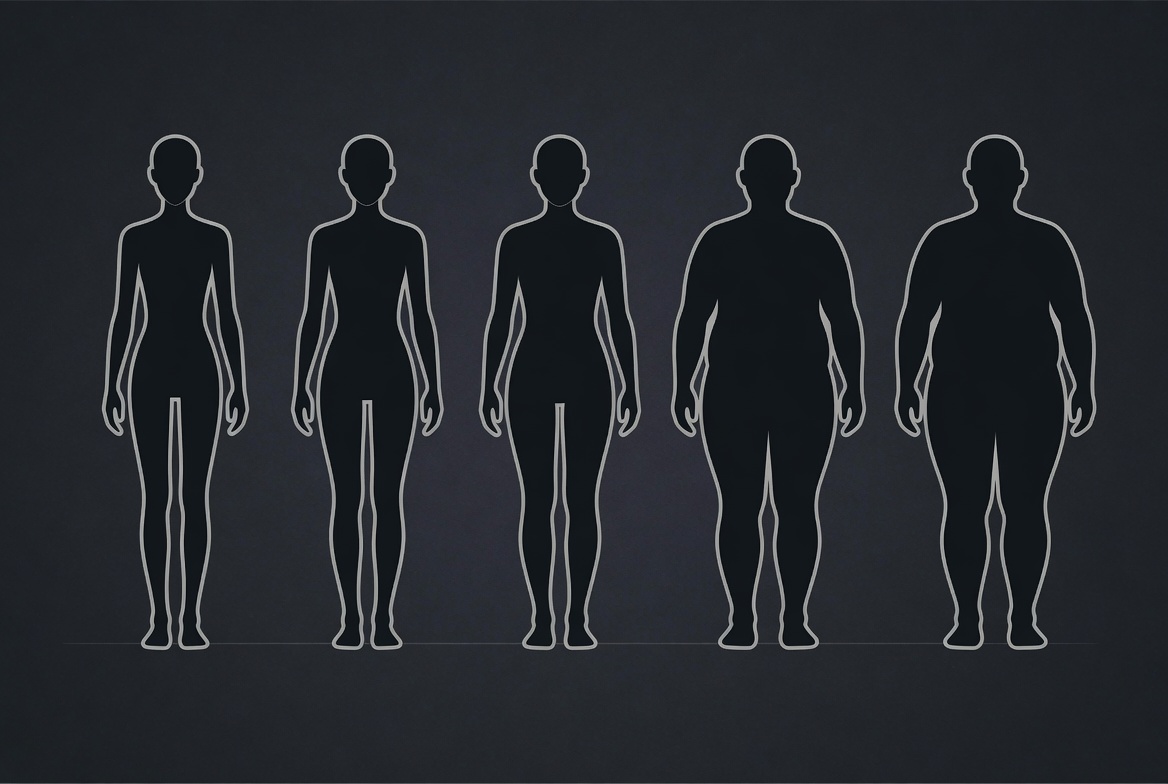
BMI Category Distribution
BMI Calculator
Your BMI
BMI Reference Table
Select your height to see BMI values across different weights. Colour-coded by WHO classification.
Tools for Tracking
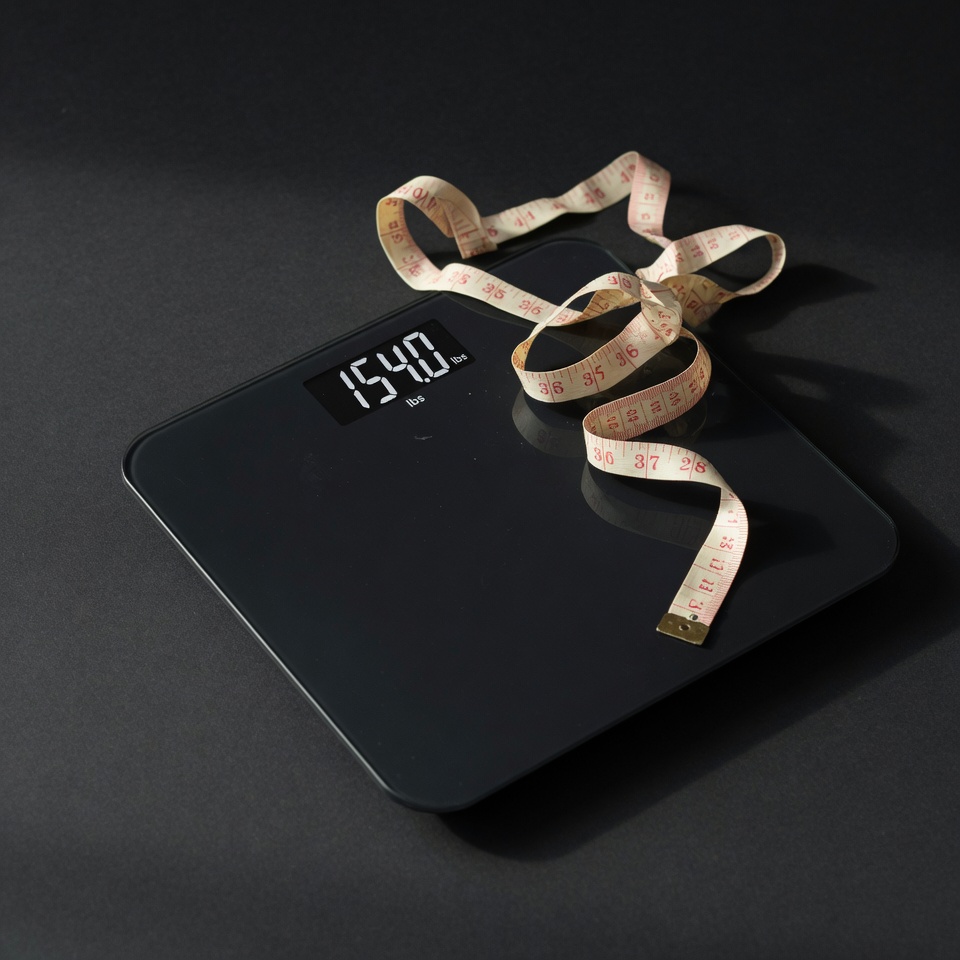
Smart Body Composition Scale
Measures BMI, body fat %, muscle mass, and more. Syncs to your phone so you can track trends over time.
Shop on Amazon →Body Measuring Tape
BMI plus waist circumference is a much better indicator of health risk than either metric alone. Measure weekly.
Shop on Amazon →Body Fat Caliper
More accurate than BMI for body composition. Track subcutaneous fat at multiple sites for trend data.
Shop on Amazon →Health Tracking Journal
Record your BMI, weight, measurements, and progress weekly. The visual trend is more motivating than any single number.
Shop on Amazon →As an Amazon Associate, I earn from qualifying purchases. Product links on this page are affiliate links — they cost you nothing extra.